
01
Your tasks are ready
Every day the app picks three tasks that fit your profile: one easy, one medium, one hard. From transport to food, from energy to waste.
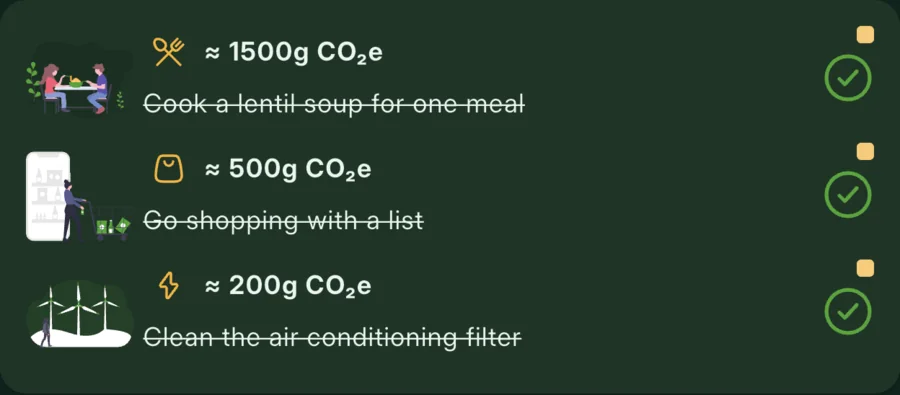
Three small tasks a day. Each one a measurable CO2 saving. Streaks, celebrations and a tree that grows with your savings: Source Green turns cutting carbon into a game you play every day.
Atmospheric CO2 at Mauna Loa, 14 October: 426.84 ppm


At the heart of Source Green is a simple loop. It starts fresh every day, and every round ends with a real carbon saving.

Every day the app picks three tasks that fit your profile: one easy, one medium, one hard. From transport to food, from energy to waste.
Done it? Tick it off with a single tap. The carbon you avoided goes straight to your account and your daily total updates.
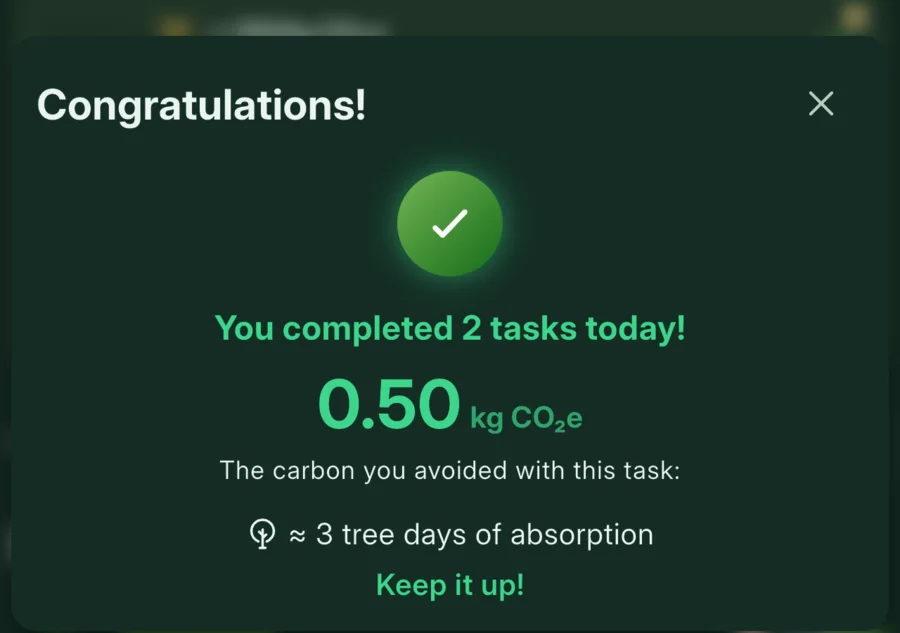
Every second task brings the milestone of the day: confetti, the tree-day equivalent of the carbon you avoided and a short "Keep it up!"
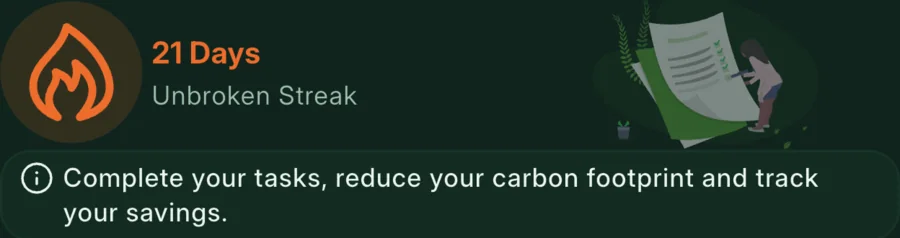
Your unbroken days are counted and your activity calendar fills up. Your history keeps every task with its date and saving.

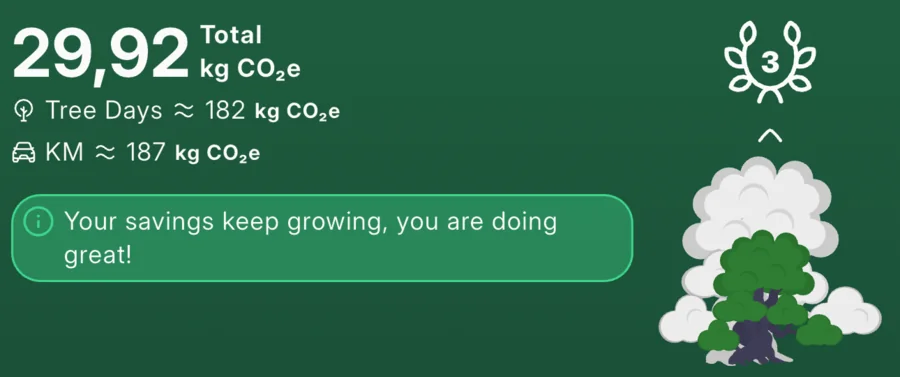
Your total savings take you through ten levels. Level two takes 5 kg; level ten takes 225 kg in total. Drag the slider and grow your own tree.
Equivalents use the app's own factors: 1 kg CO2e is about 6.2 km in a petrol car, 26 cups of coffee and 6 tree-days (a tree absorbs 60 kg of CO2 a year).
Compare your weekly footprint with the Paris Agreement target. While the gauge stays green, you are below the target.
Paris target: 47 kg / week
Where did you make the biggest difference this month? The ring chart and ranked bars tell you.
AI compares today's saving with yesterday's and writes you a short comment.
What 29.92 kg of savings means in the real world. The app converts every total into these units.
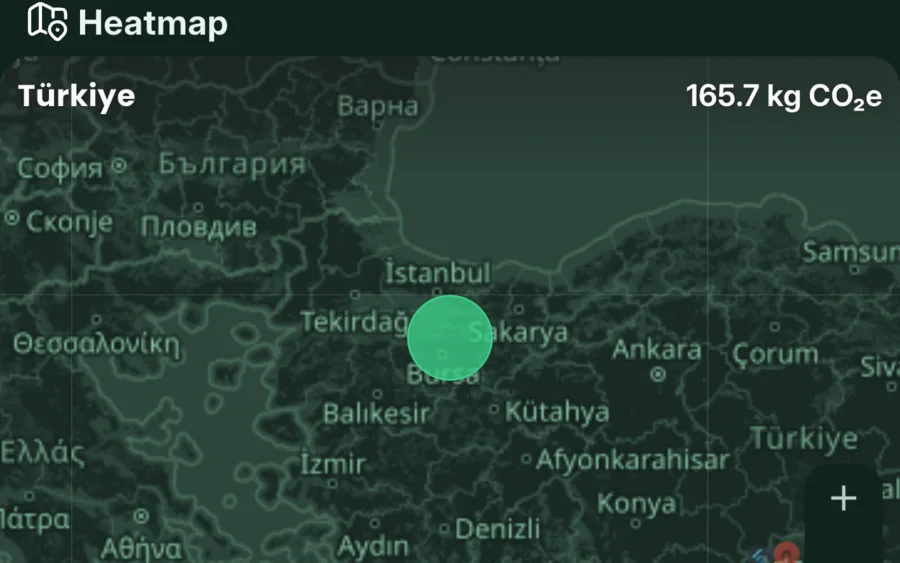
See collective savings district by district, with a district ranking. Districts with fewer than three users are never shown.
Atmospheric CO2 measured at Mauna Loa, from NOAA data every day. The last 30 days:
Sign in with Apple, Google or email. Lock the app with Face ID if you like; it opens in your phone's language.
100 tasks in every category, from easy to hard. The app shows the carbon each task avoids and the source behind the number.
Task savings are based on published emission factors. Each factor's publisher, year and link are listed on the Data Sources screen in the app.
tasks tied to a published source
Carbon figures in the app are estimates, not binding measurements.
The heat map only shows districts with at least three users. Your location is kept at province and district level only.
The app has no ads and no third-party analytics. Your data is never sold for marketing.
Account and usage data is stored on AWS servers in Frankfurt, with encrypted backups.
You can delete your account in the app. Your tasks, codes and notifications go with it.
Daily tasks and celebrations, savings, live CO2 readings, the city map and the data sources. Screens recorded in the app itself.
Write to the Source Green team; we are here for support, partnerships, press and data protection requests.